
Yuxuan Chen


A user-focused UX designer with expertise in visual design. Through empathy and deep user insights, I am committed to delivering products that truly meet user needs.
A user-focused UX designer with expertise in visual design. Through empathy and deep user insights, I am committed to delivering products that truly meet user needs.
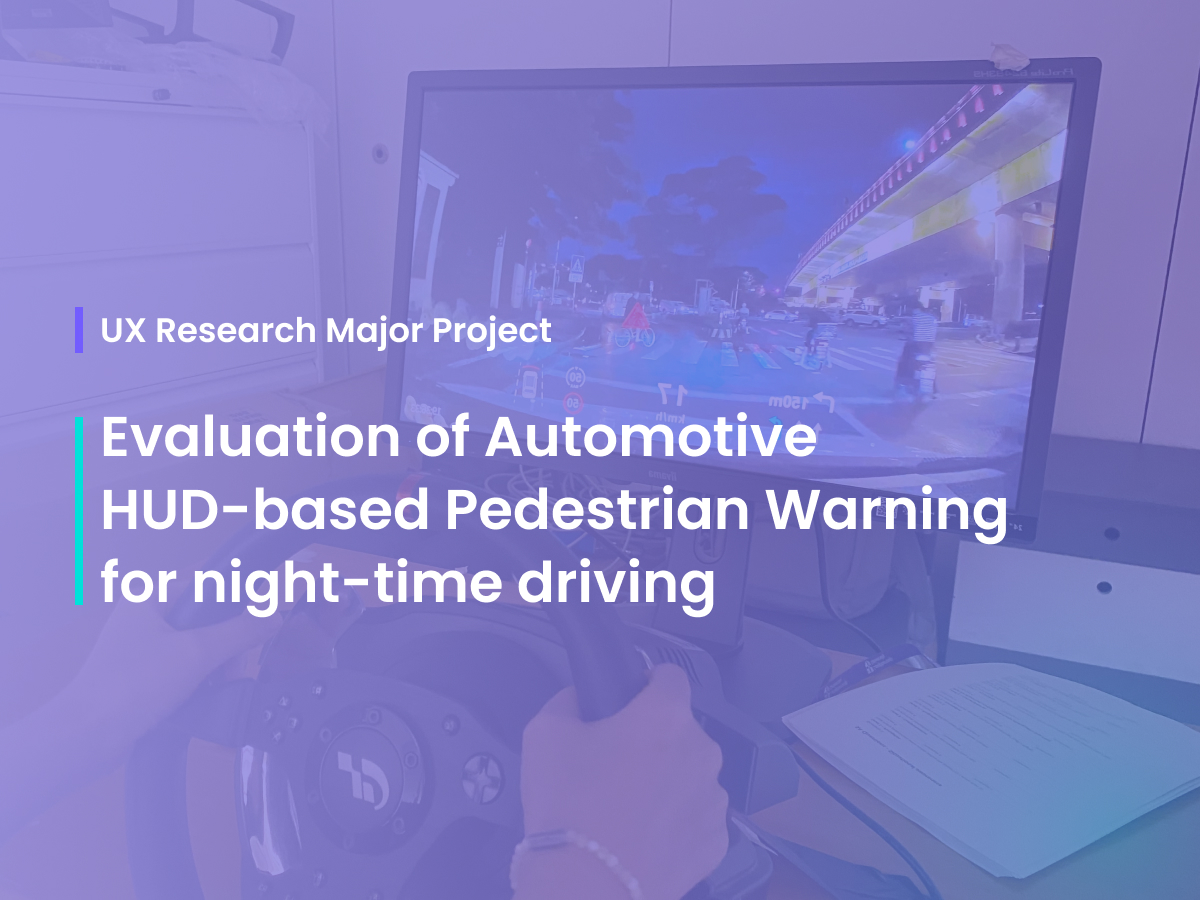
According to global traffic safety statistics, a significant number of pedestrian fatalities occur in low-light conditions. The cognitive and perceptual demands of night driving often exceed human attention and reaction capabilities, making it a key area for technological research(Wood, Tyrrell and Carberry, 2005). There have been many studies showing that Head-Up Display(HUD) is an effective solution, supporting faster reaction times and awareness of the environment.
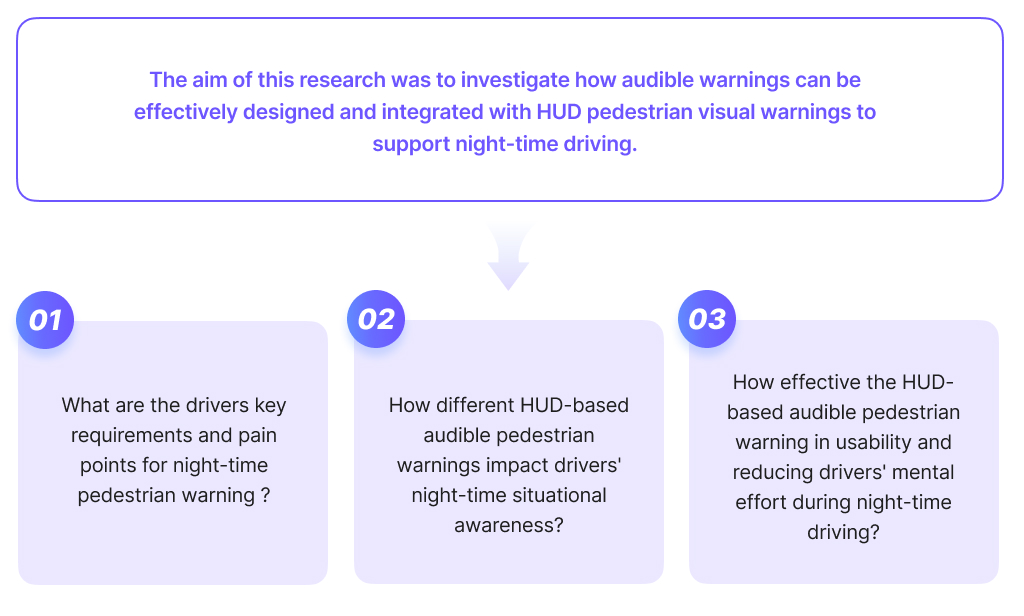
However, there is still a lack of research on pedestrian-specific HUD warning systems. Most related researches focus on the technical performance of detection systems, the user experience of pedestrian warnings, especially how well the message is delivered and understood by the driver, remains under-explored.
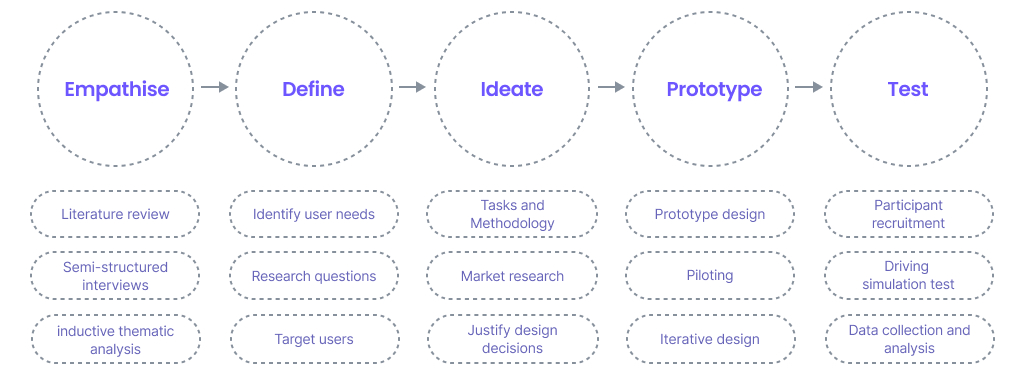
Research methodology included collecting primary data through semi-structured interviews to understand users’ real needs and pain points, defining more specific research directions. Existing intelligent driving systems on the market were investigated to provide reference for prototype design. Three different prototypes were developed and tested in a controlled driving simulation environment, using both subjective and objective measures to gain a comprehensive view of effectiveness. The research process was based on the Design Thinking Process.
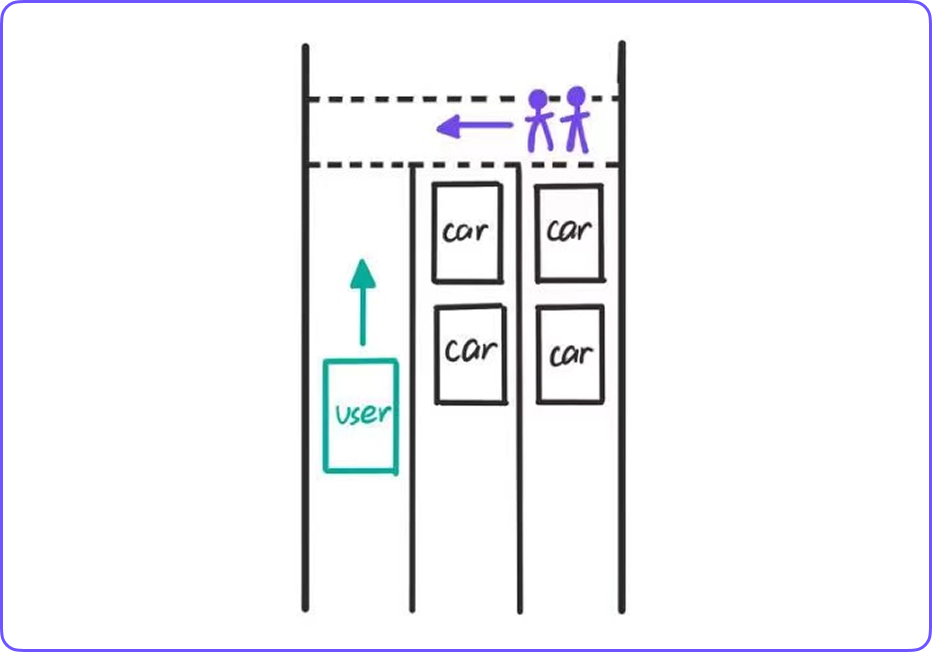
Three night-driving scenarios were selected according to driving scenarios perceived as challenges by participants in the interviews, each with different pedestrian-related hazards.
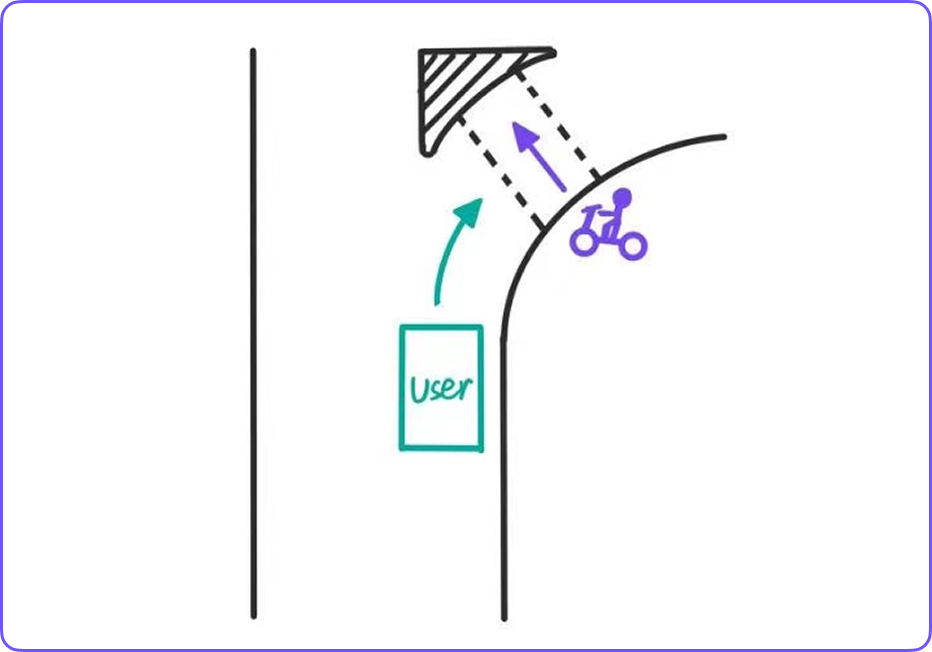
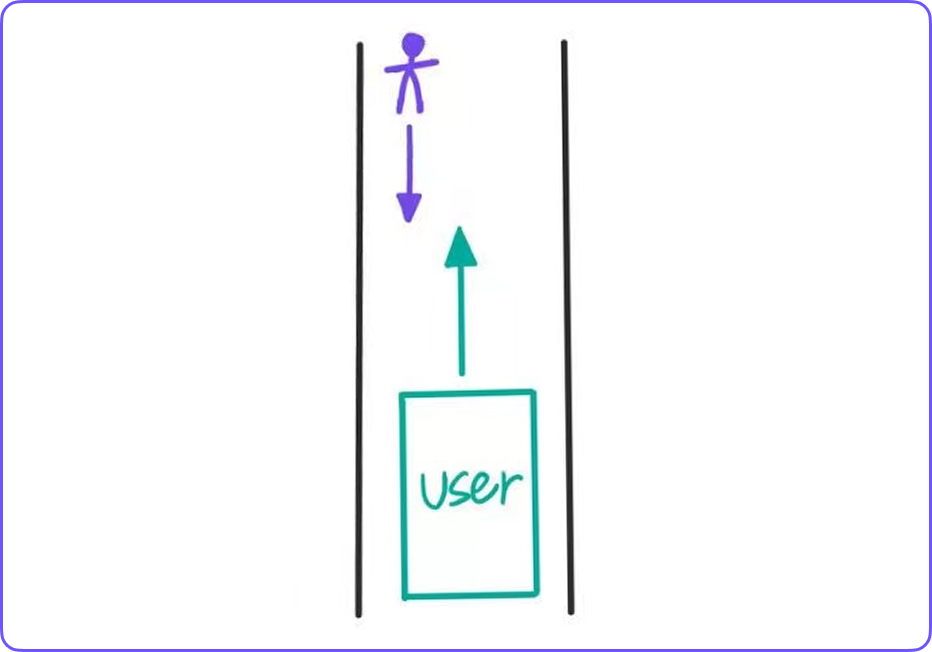

The prototypes were developed using Adobe After Effects (AE), which enabled the creation of video-based simulations with dynamic AR effects.
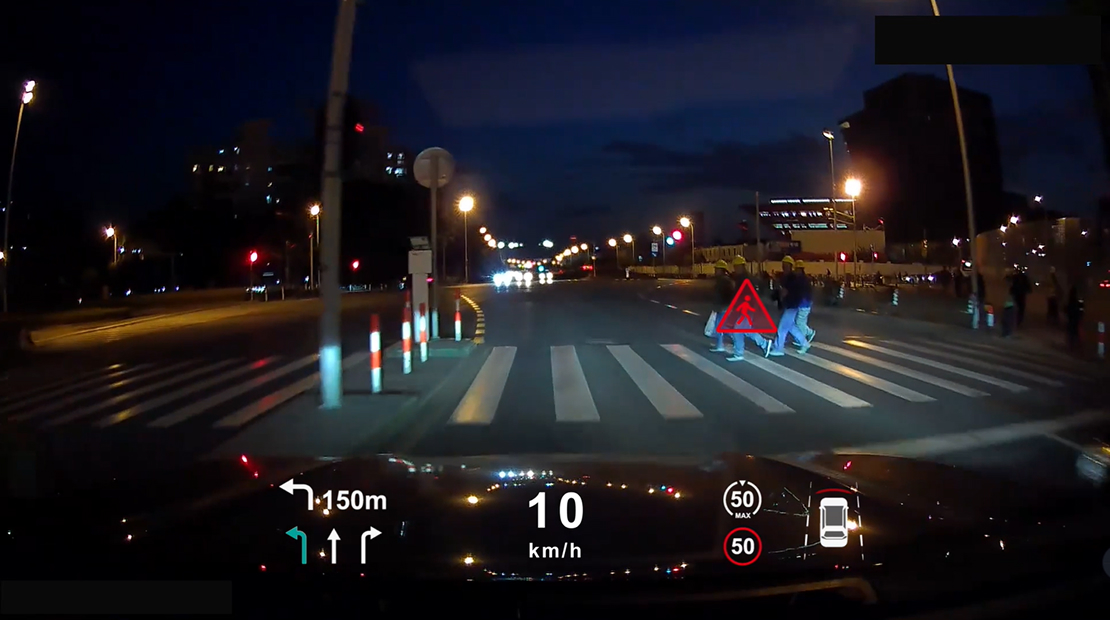
An animation-based approach was employed to enhance realism and convey dynamic changes. Icons can change in response to simulated driving scenarios, including variations in vehicle speed, lane changes, and turn signals. Pedestrian warning icons were designed to move following pedestrian track and to flash.
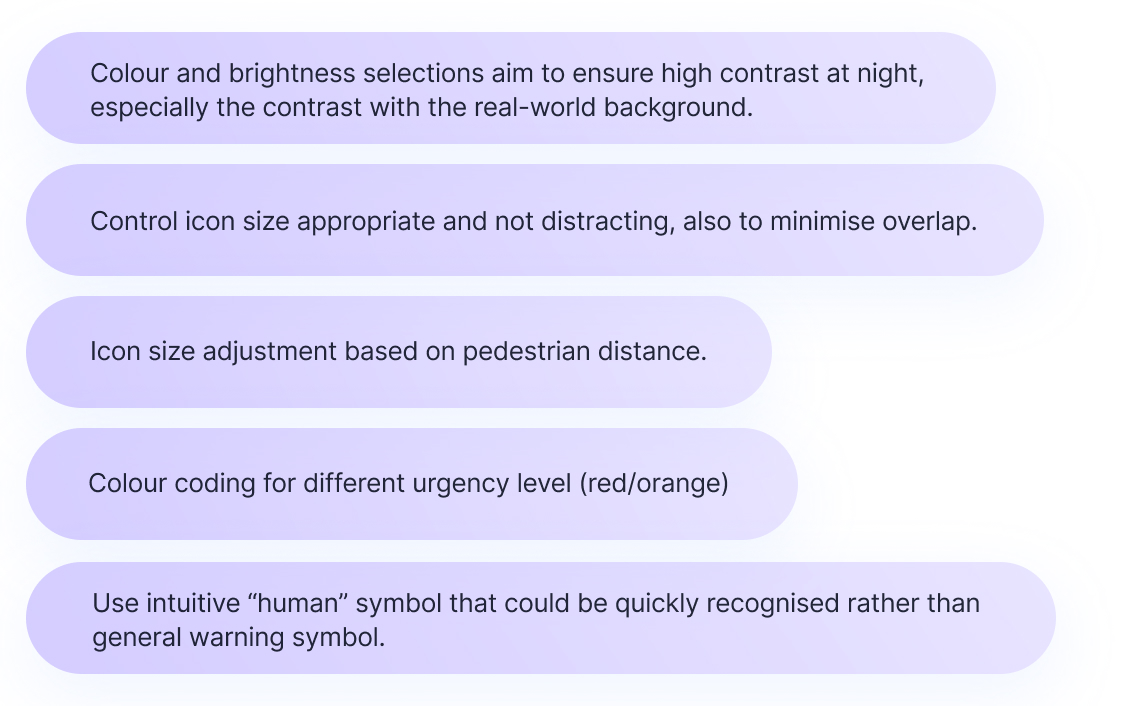
The icon components were initially inspired by HUAWEI AR-HUD system but were improved based on insights gained from the primary user interviews. The design adjustments aimed to help drivers process the warnings without being overloaded.

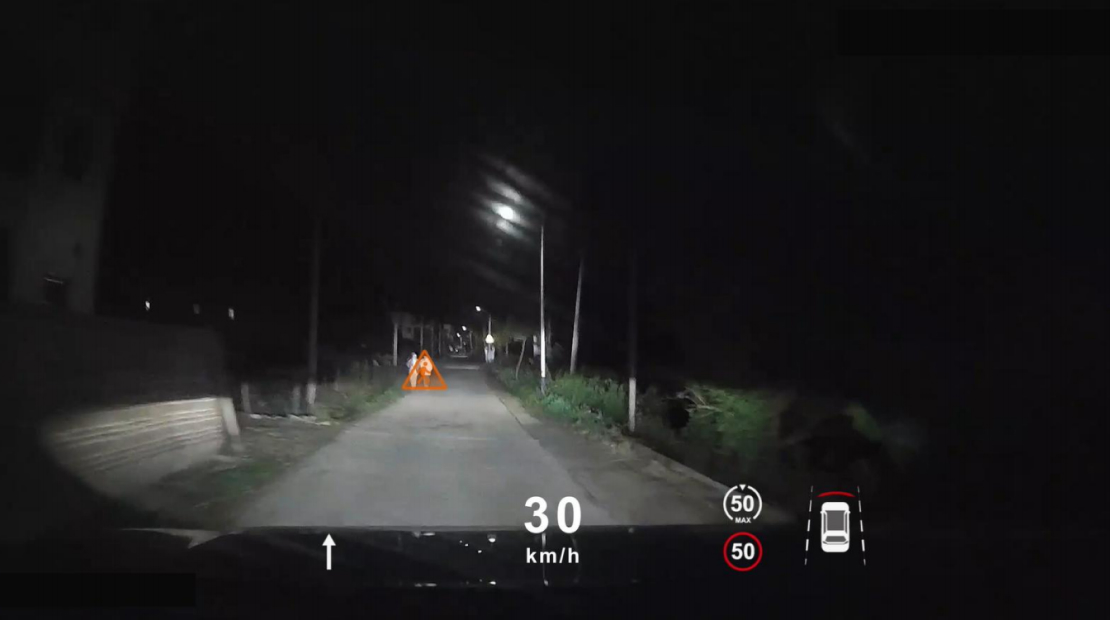
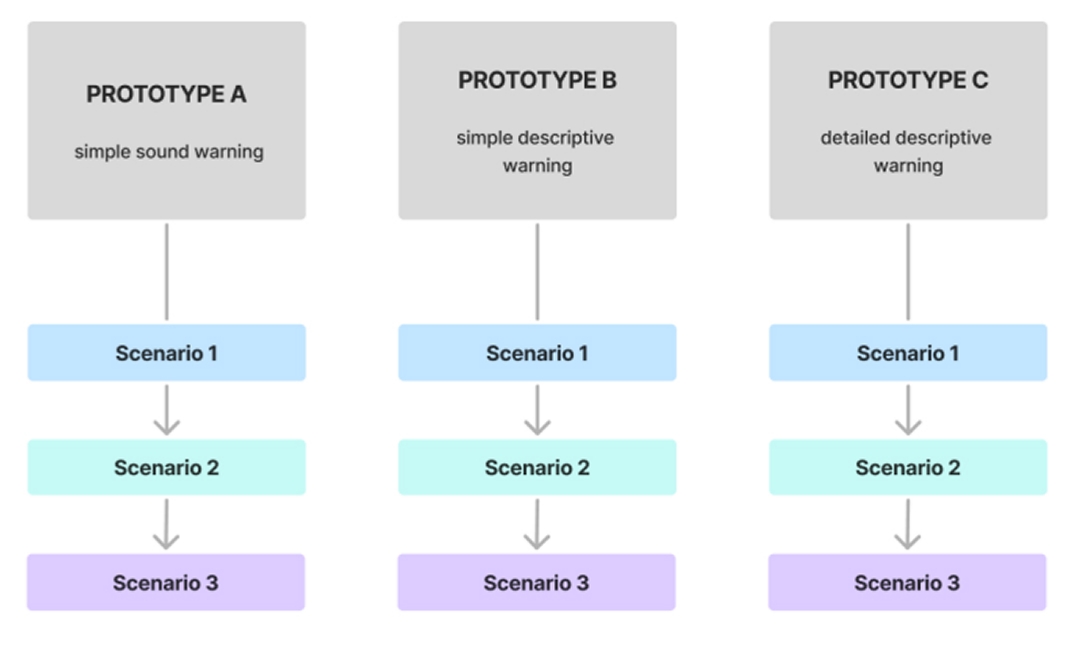
For the audible part, warnings were developed with three different levels of complexity. They were all combined with the consistent visual HUD, and form three prototypes, each with three scenarios.
The audio is generated by professional translation software, ensuring a neutral and calm English voice.




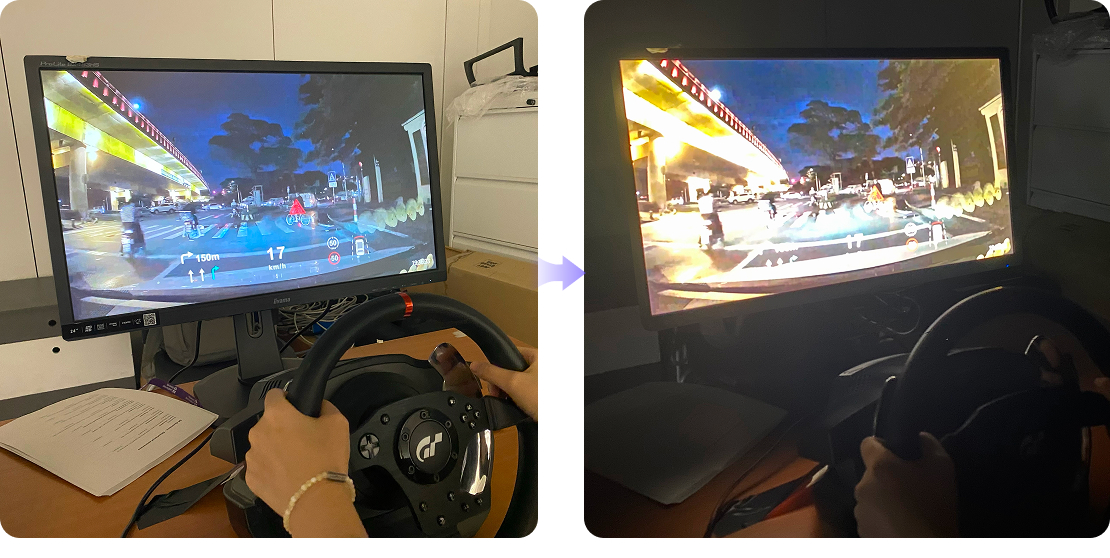
A display screen and steering wheel model are primarily used and adjusted in height and distance to simulate the driving environment. In addition, the brightness of the room is controlled to simulate night-time conditions, providing participants with a more immersive experience.
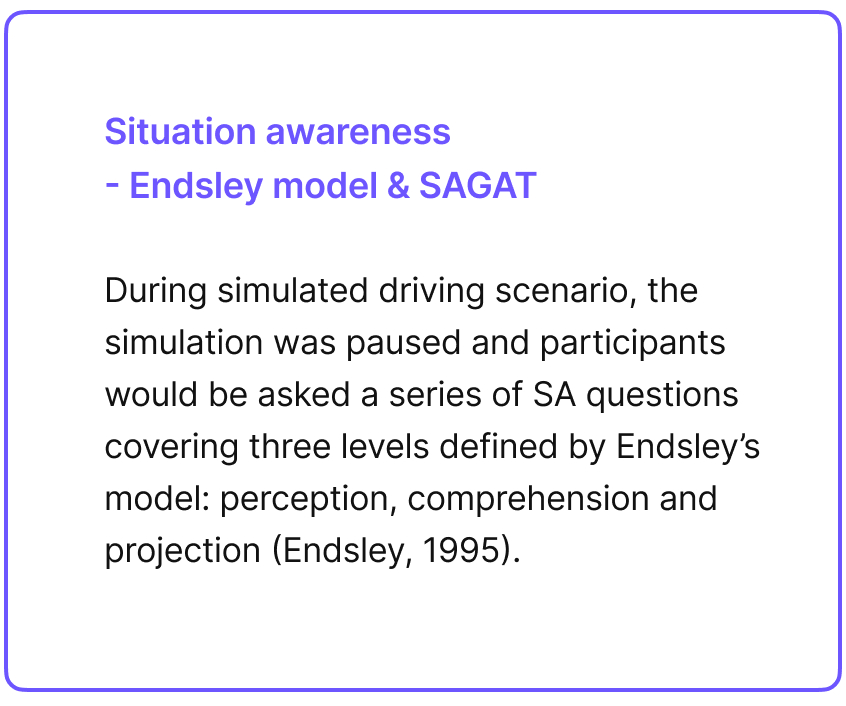
Descriptive statistics: All three HUD prototypes demonstrated high SA scores, with average correct rates above 90%. Prototype B and Prototype C performed slightly better than Prototype A, both achieving a correct rate of 93.33%, while Prototype A achieved 91.11%. Accuracy is high across all systems, indicating that participants maintained strong situation awareness regardless of the prototype.
Statistical tests: The result (Chi-Square =2.000, p= 0.368) showed that there was no statistically significant difference between the three prototypes in terms of situation awareness.
“B will suit most driving situations, emergency or non-emergency, especially for emergencies
“C makes me feel the best because it gives me more detailed instructions ahead of time compared to A&B and tells me directly what to do.”
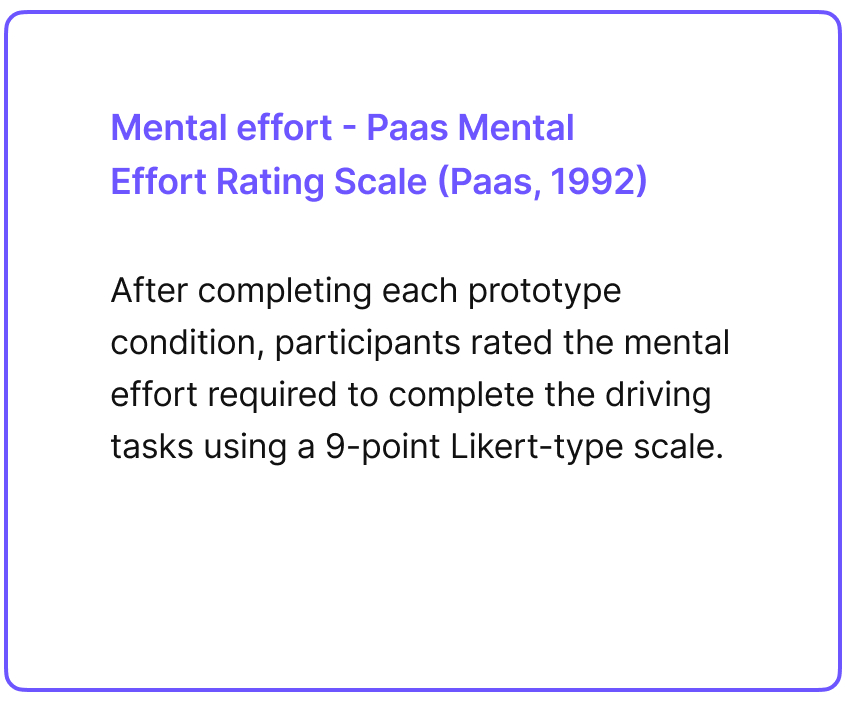
Descriptive statistics: Prototype B had the lowest average mental effort (Mean = 2.93, std dev=1.38), followed by Prototype C (Mean = 3.80, std dev=1.52). Prototype A was the most demanding (Mean = 4.00, std dev=1.73).
Statistical tests: The overall ANOVA result (p = 0.057) indicated that the difference between three prototypes was not statistically significant. However, the Bonferroni pairwise comparison showed a statistically significant difference between prototype A and prototype B (p=0.037), favouring Prototype B require significantly less mental effort.
“C There is too much content in the auditory warning. I need to spend more attention to recognise the content.”
“I must rely on visual warnings because I don’t know why the alert(A) was ringing, and without visual warnings I need some time to find out what’s going wrong.”
Descriptive statistics: Prototype B had the highest SUS score (Mean = 82.33, std dev=6.78) and the most consistent responses. Prototype C had the lowest mean (Mean = 73.67, std dev=14.94), suggesting inconsistent user experience. Prototype A performed moderately (Mean = 76.50, std dev=9.72).
Statistical tests: The ANOVA result was not significant (p = 0.071), and the Bonferroni pairwise comparison did not show statistically significant pairwise differences at the 0.05 level.
“The system reacted in time before I took action, warning me before I noticed the pedestrians, especially in the blind spots of my vision.”
“Although C with specific prompts is good, I prefer the beginning of B ‘attention’, probably because I’m not a native English speaker and I’m less sensitive to C’s descriptive language.”
Based on the quantitative and qualitative feedback from the experiment, here are some design recommendations.

To strengthen generalisability, future research needs to broaden samples and contexts, recruiting elderly or low-vision drivers. In addition, expand testing contexts, such as more complex road conditions with pedestrian hazards or complex weather conditions.
Moreover, integrating real-time measures of situational awareness or testing HUD prototypes in real vehicles would increase the validity and ensure that the findings more accurately reflect real-world driving contexts.
In addition, exploring drivers’ long-term adaptation and trust in HUD pedestrian warning systems is important, to see if design choices remain effective after long-term exposure.